Oxford Road Cuts Dashboard Load Time by 75% with Tableau

Oxford Road partnered with Kander® to move beyond Quip-based reporting and test Tableau as a faster, more scalable way to analyze campaign performance. The engagement helped Oxford Road reduce dashboard load time, speed up campaign reporting, and give executives clearer access to the insights they need to optimize ad spend and client performance.
| Client Name | Oxford Road |
|---|---|
| Industry | Media & Advertising |
| Project Length | Tableau Proof of Concept |
Key Technologies



Kander® used Tableau and AWS Athena to help Oxford Road move beyond manual Quip reporting. By shifting complex calculations to the backend and optimizing dashboard structure, Kander® helped the team create faster, more scalable reporting for campaign performance.
About the Client
Oxford Road is a media agency focused on podcast, audio, and creator-based advertising. The company helps brands plan, buy, measure, and improve campaigns across creator-led media channels, where performance data plays a major role in client reporting and campaign decisions.
The Challenge
Oxford Road was using Quip for reporting and collaboration, but the team needed more than spreadsheet-style campaign views.
Their reporting process was too manual, slow to update, and difficult to scale across large volumes of advertising data. Reports could take several days to update, and teams lacked one clear place to review campaign performance, compare results, and make timely decisions.
Oxford Road needed a faster, more reliable way to give executives and campaign teams access to useful reporting without relying on manual exports, scattered tools, or static tables.
How We Helped
Kander® partnered with Oxford Road to complete a Tableau Proof of Concept and compare Tableau’s performance against Quip and existing legacy dashboards.
Tableau Proof of Concept: Tested Tableau as a stronger reporting option for campaign performance, executive visibility, and scalable analytics.
Dashboard Optimization: Reduced 1,848 UI-level calculations by moving them into AWS Athena backend queries, improving dashboard performance and reducing front-end complexity.
Data Extract Refinement: Shifted dashboard extracts from four years of campaign data to rolling 12–24 month views, while separating historical reporting into dedicated dashboards.
Improved Filtering: Applied context and hierarchical filters to improve dashboard responsiveness and make it easier for users to find the information they needed.
Role-Based Views: Implemented user-based row-level security so executives, analysts, and campaign managers could access reporting that matched their roles.
Reporting Comparison: Benchmarked Tableau against Quip-based reporting to show where Tableau could improve speed, usability, and confidence in the data.
The Impact
The Tableau Proof of Concept delivered clear performance and reporting improvements for Oxford Road:
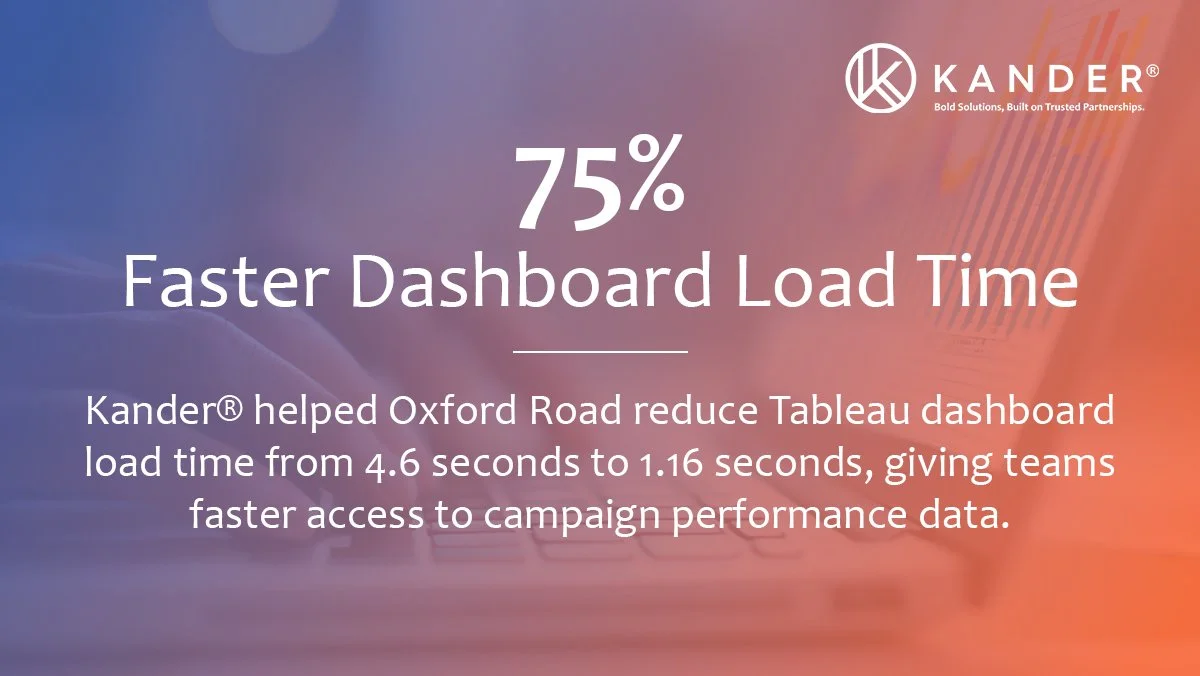
Faster dashboard performance: Dashboard load time was reduced from 4.6 seconds to 1.16 seconds, a 75% improvement.
Faster campaign reporting: Campaign reports could be generated 3x faster compared with manual Quip tables.
Stronger scalability: Tableau handled two years of campaign data smoothly, with a path toward supporting five years of campaign reporting.
Higher executive adoption: 90% of executives shifted from Quip-based reports to Tableau dashboards within the first month.
Better user confidence: Teams reported a 40% improvement in ease of use and confidence in insights.
Time savings: Faster reporting and automation saved an estimated 250+ analyst hours annually.
Looking Ahead
With Tableau in place, Oxford Road has a stronger foundation for faster campaign reporting, better executive visibility, and more confident decision-making.
The Tableau proof of concept also opened the door for broader analytics use across media operations, finance, and campaign management. As Oxford Road continues to grow its reporting maturity, the team is better positioned to explore deeper Salesforce analytics opportunities, including Data Cloud, audience insights, and predictive modeling.
Is Manual Campaign Reporting Slowing Your Teams Down?
Kander® helps teams move from static reports and scattered spreadsheets to faster, cleaner Salesforce analytics that leaders can actually use.